Urban networks
Smart city air quality monitoring — distributed sensing with discipline
Cities are heterogeneous: a kerbside corridor and a residential street a block away can differ by an order of magnitude. Distributed sensor networks resolve that spatial detail — provided they are designed, maintained and interpreted as networks, not isolated devices.
Architecture
Components of a smart city network
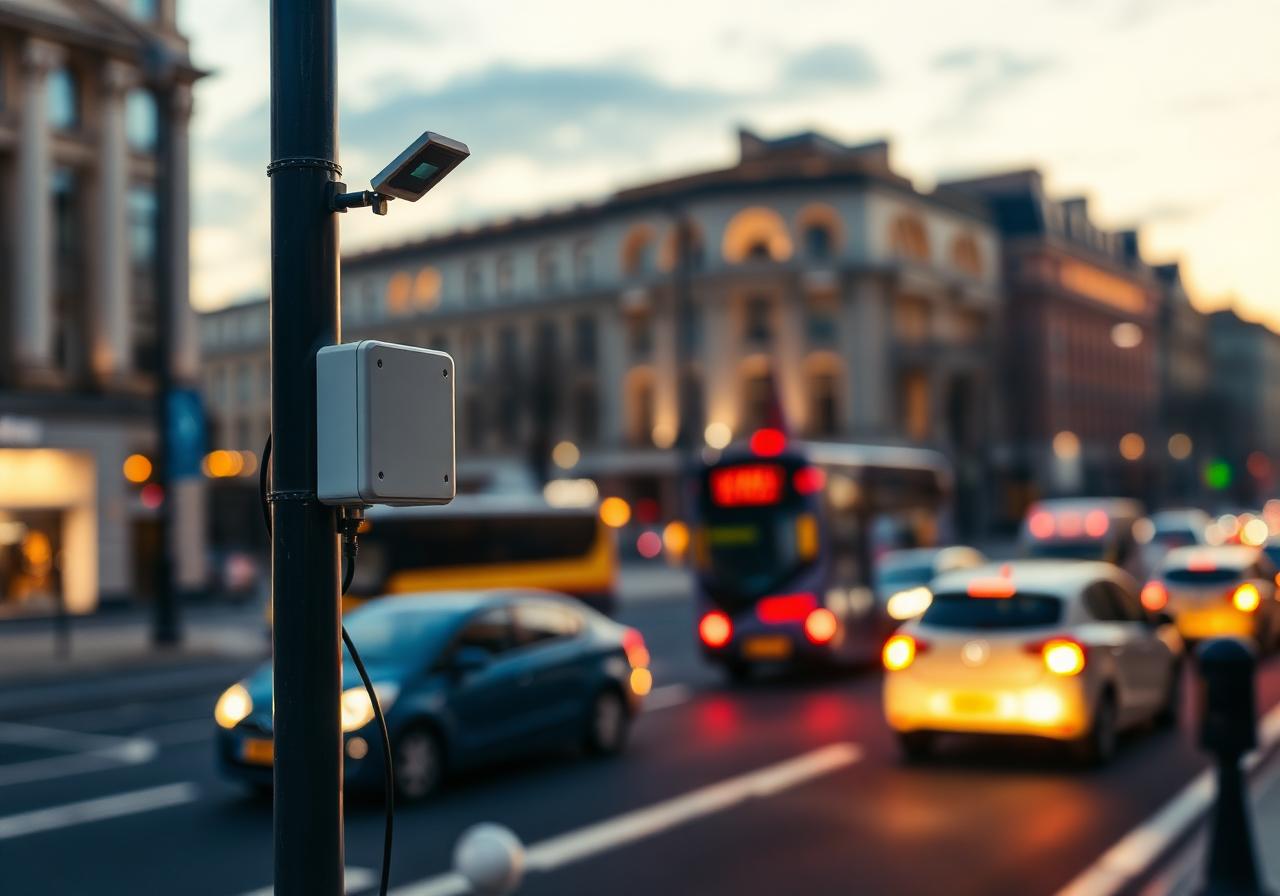
Fixed nodes
Pole-mounted sensor packages — typically PM, NO2, O3, temperature and humidity — providing continuous time series at known locations.
Mobile sensors
Vehicle- and bicycle-mounted units that map exposure along routes; valuable for hotspot identification, less so for long-term trend at a point.
Gateways and connectivity
LoRaWAN, NB-IoT and cellular each suit different urban geographies. Coverage planning is part of network design.
Cloud platforms and GIS
Ingest, validate, store and present data through dashboards and mapping layers that users — public or operational — can act on.
Data quality at scale
Reference co-location is non-negotiable
Distributed sensors are not reference instruments. They drift, respond to interferents and age differently across a network. Co-location with a reference analyser — at the start of deployment and periodically thereafter — builds the correction relationship that turns indicative data into defensible data.
The correction itself is rarely a single number. Temperature, humidity and concentration regime all influence sensor response; the relationship is captured in a model and applied to every measurement before it reaches the dashboard.
Without this discipline, the spatial map looks compelling and means very little. With it, the network earns its place alongside the reference station.
Use cases
What urban networks deliver
| Audience | Network role | Reference station role |
|---|---|---|
| Local authority air quality team | Hotspot identification, intervention monitoring | Statutory reporting |
| Schools and healthcare estates | Outdoor context for indoor decisions | Background reference |
| Public dashboards | Neighbourhood-scale insight, engagement | Authoritative city-wide value |
| Transport and planning | Before/after assessment of interventions | Long-term trend baseline |
| Research and academia | High spatial-resolution datasets | Reference for correction models |
Limits
Honest about what urban networks cannot do
Not regulatory
Low-cost networks supplement, not replace, regulatory reference monitoring under UK and European frameworks.
Maintenance overhead
Sensors fail, vandals strike, batteries die. A network without a maintenance budget is a network in decline.
Connectivity gaps
Urban canyons and underground locations defeat radio links. Site selection trades coverage against representativeness.
Privacy considerations
When location and occupancy data fuse with air quality, governance frameworks apply. Design accordingly.
Suitable for
Who deploys urban networks
Local authorities
Air quality action plans, low-emission zones and intervention monitoring.
Universities and research
Spatial exposure studies and sensor performance research at city scale.
Large estates and campuses
Multi-building monitoring with shared infrastructure and unified dashboards.
FAQ
Smart city network questions
Discuss an Air Quality Monitoring Project
Network design, sensor selection, co-location strategy and mapping for UK urban and campus deployments.
Explore connected monitoring solutionsPollution monitoring